12.8 Other interactive alternatives
12.8.1 taucharts
taucharts is my favorite package for interactive scatter plots for two reasons: tooltips automatically include every variable in your data frame, not just the two being plotted; and you can add a dropdown menu to choose different models for trend lines.
This code:
tauchart(winners) %>%
tau_point("Total", "Baker.pct", color="Winner") %>%
tau_guide_x(label="Total Votes") %>%
tau_guide_y(label="Baker Pct") %>%
tau_tooltip() %>%  # includes all variables in mydf
tau_trendline( showPanel = TRUE )  %>%
tau_title("2014 MA Governors Results")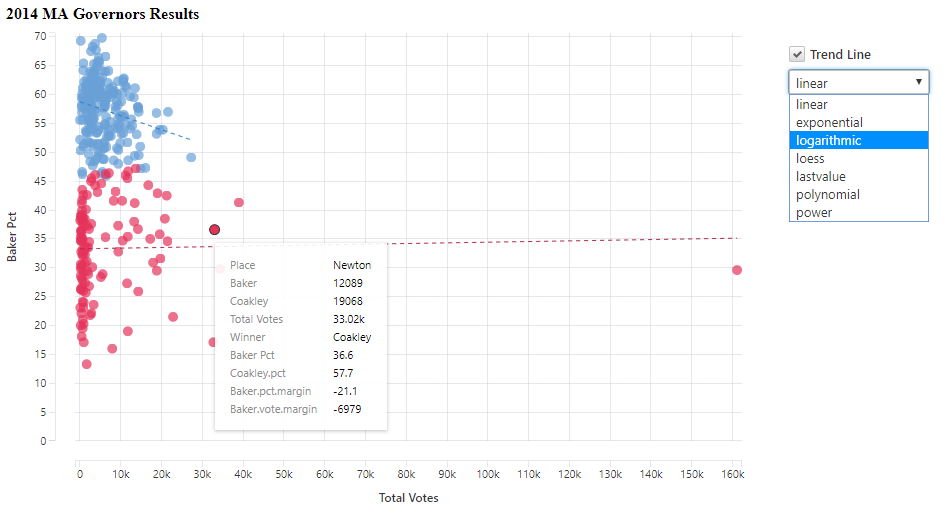
Figure 12.12: Scatter plot created with taucharts.
Produces a graph like Figure 12.12.
I’ve had occasional problems viewing taucharts graphs in the RStudio viewing panel, but clicking the “show in new window” icon above the panel to open the visualization in a browser usually works fine. See more about the taucharts R package at http://rpubs.com/hrbrmstr/taucharts.
12.8.2 highcharter
Highcharter is an R wrapper to one of my favorite JavaScript libraries, Highcharts. Both the original library and R package are well documented, and the graphics make for publication-quality visualizations. Note, however, that Highcharts.js is only free for personal and non-profit projects; government and commercial use require a paid license (see more at highcharts.com). The highcharter package can be installed and loaded like any other from CRAN with install.packages() and library() or pacman::p_load().
highcharter’s hchart() function is similar to ggplot2 graphing in that “You pass the data, choose the type of chart and then define the aesthetics for each variable,” package creator Joshua Kunst explains on the package’s website. See more at jkunst.com/highcharter.
12.8.3 metricsgraphics
This R wrapper and htmlwidgets implementation of the MetricsGraphics.js library can create interactive line charts, bar charts, and scatterplots. More information is available at the package’s website, http://hrbrmstr.github.io/metricsgraphics/.
To see other interactive R package options, check out the HTML widgets gallery at http://gallery.htmlwidgets.org.