3.3 Simple stock market graphing
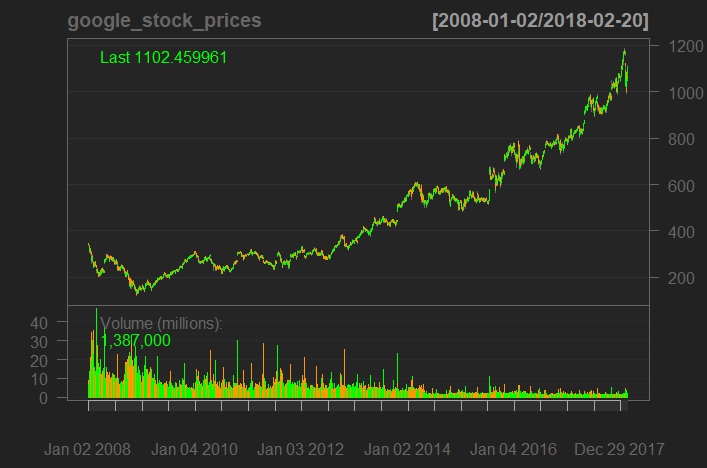
How did Google stock do since the 2008 stock market crash? Let’s take a look … with these two lines of code:
google_stock_prices <- getSymbols("GOOG", src = "yahoo", from = "2008-01-01",
                                  auto.assign = FALSE)
chartSeries(google_stock_prices)

Figure 3.1: Graphing Google stock prices with the quantmod package
Setup notes: You can type each line of code into the console, but it will be more convenient in the long run to set up a script file for this chapter. Go to File > New File > R Script (or use the keyboard shortcut Ctrl-Shift-N on Windows / Cmnd-Shift-N on Mac). Type the commands into the script file, save it with the disk save icon, File > Save, or the ctrl/cmnd-S keyboard shortcut.
To run all the code in the file, you can click the Source link above and to the right of the script panel (which is the top left panel). To run a few lines of code, select them the usual way (click and drag with your mouse) and hit control-Enter (command-Enter on Mac). To run one line of code, put your cursor anywhere on that line and hit control-Enter or command-Enter. When you do that, your cursor will jump to the next line of code and you can hit control/command-Enter again to quickly run the next line of code.
getSymbols() is quantmod’s powerful function for getting historical financial data from the Internet and importing it directly into R. src = yahoo tells quantmod that I want to pull the data from Yahoo; I could also have specified google to import from Google Finance. from tells quantmod when to start pulling the data. And auto.assign=FALSE deals with a quirk in older versions of quantmod, so it behaves like most R functions and can store functions in an R variable with the <- assignment operator.
The dygraphs package can make this graph interactive, so that you can mouse over the line and see underlying data, as well as click and drag to zoom in on a portion of the graph. It will look something like Figure 3.2. Again, just one line of code, this one specifying “I just want the GOOG.Close column (with closing prices) and a title of”Google Stock Price Starting in 2008".
Figure 3.2