- Value of states won for Democrats
- Value of states won for GOP
- Clinton delegates by day
- Trump delegates by day
- Democratic results map
- GOP results map
- Bernie Sanders results vs state African-American population
My Primary/Caucus Data Analyses
Sharon Machlis
June 8, 2016
The following data visualizations and analyses were done with R.
Value of states won for Democrats
Number of delegates awarded the winner minus number of delegates gotten by the runner-up
Value of states won for GOP
Winner’s number of delegates minus the runner-up’s number of delegates. Note: Pennsylvania currently under-represented because most delegates technically unbound even though Trump won the state.
Clinton delegates by day

Trump delegates by day

Democratic results map
Color intensity is based on the number of delegates awarded the winner minus number of delegates awarded the runner up. Click a state for more details.

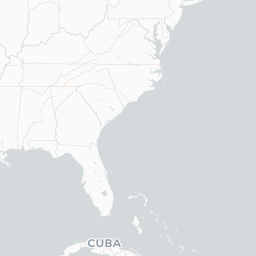


GOP results map
Color intensity is based on the number of delegates awarded the winner minus number of delegates awarded the runner up. Click a state for more details.
Bernie Sanders results vs state African-American population
Purple represents caucus states; green is primaries. Size of circle represents state population.